| Category of vision impairment | Distance visual acuity range |
| Mild vision impairment | Worse than 6/12–6/18 |
| Moderate vision impairment | Worse than 6/18–6/60 |
| Severe vision impairment | Worse than 6/60–3/60 |
| Blindness | Worse than 3/60 |
| Near vision impairment: worse than ( N_6 ) or 8M at 40 cm | |

Fig. 1.8 The Berkeley Rudimentary Vision Test (BRVT)
1.4.2 Measuring Visual Acuity in Children
Visual acuity testing is vital for detecting ambly opia. Therefore, it is important to avoid single- line and single-optotype testing. Test results with full chart vs. single line and single optotype can be variable, with the acuity estimates of the latter two techniques over-estimating visual acuity in amblyopia compared to the entire chart [37].
Visual acuity measurement in children can prove to be tricky. The optotypes should be shuffled while checking monocular acuity, and rechecking the same acuity line may lead to issues as children are likely to memorize the let ters. In case of unavailability of an extra acuity chart, the letters could be asked to be read ran domly or in reverse order. This problem is pre vented in electronic visual acuity charts.
The choice of visual acuity tools in children cannot always be limited to chronologically age- appropriate tests. In such cases, alternate testing tools/techniques should be explored. For exam ple, if a 10-year-old girl diagnosed with Down syndrome cannot respond verbally to letter opto types, she can be asked to copy the letters (alter nate technique), or testing with symbols/picture optotypes can be considered (alternate testing tools). Grating/resolution acuity tests are popu larly used among infants, young children, chil dren, and individuals with special needs, although acuities obtained using resolution and recogni tion acuity tests may not be comparable [38].
In using grating acuity tests (e.g., Teller acuity cards-II), it is important to mask the clinician to the location of the grating to avoid clinician bias. Firstly, the child's verbal/non-verbal response (finger pointing or based on eye movement) should be recorded by the clinician, and then the location of the grating should be checked on the card to judge whether it is a correct or incorrect response. For thresholding purposes, 2 of 3 correct criteria are suggested. When using grating paddles such as LEA grating paddles (Fig. 1.9), it is important to move both the paddles (plain and the grating) equally to avoid movement-initiated eye movement.
The chart used should also be documented, and if possible, the same chart should be used in the follow-up visit as well, as the acuities obtained with various tests may not be comparable [39, 40]. Good documentation is essential for an appropriate clinical interpretation of the acuity measure (e.g., progression with intervention). When documenting grating acuity, the cycles per centimeter (CPCM) should be converted to CPD (Box 1.4).
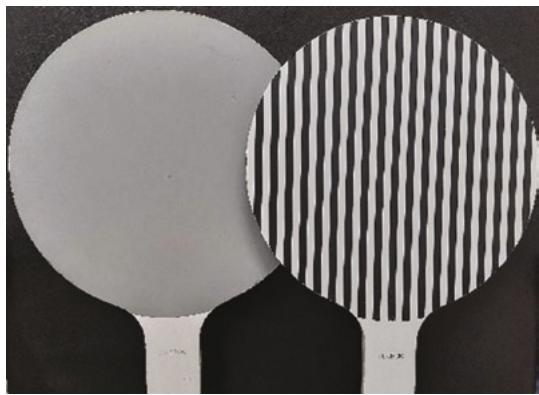
Fig. 1.9 LEA grating paddles
Box 1.4: An Example Computation to Convert Cycles Per Centimeter to Cycles Per Degree
(at 57 cm, 1 cm = 1° of visual angle; there fore, at 57 cm, CPCM~CPD)
For e.g., 10 CPCM at 38 cm = (38/57) × 10 = 6.66 CPD
(CPCM cycles per centimeter, CPD cycles per degree)
CPD = (testing distance/57) × CPCM
1.4.3 Measuring Near Visual Acuity
In near visual acuity measurement (ideal to record in “M” or “N” notation), it is important to mention the testing distance, chart, and illumination used for recording the acuity. While testing individuals with visual impairment, testing distance helps to determine the magnification required for near assistive devices. In addition to room illumination, extra illumination, when used, should be documented as well, as patients with impaired contrast sensitivity may have better near acuity with extra illumination. For individuals unfamiliar with words, alternate tools such as isolated letter charts, numbers (Fig. 1.10), symbols, tumbling E, and Landolt C should be considered for measurement purposes.
1.4.4 Contrast Acuity and Contrast Sensitivity
The assessment of LCVA is similar to that for HCVA, with the same thresholding criteria (3 of 5 optotypes). Assessment of LCVA at 2.5% was reported to help detect certain ocular conditions such as optic neuritis [41] and multiple sclerosis [42] and for a few occupational requirements, such as those for pilots [43]. However, in the clinic, the LCVA is conventionally assessed at 10% contrast, and HCVA is assessed at 95–100%, as most of the functional visual tasks are within this range of contrast. Reduction of acuity at 10% contrast sensitivity is important as it would mean a tenfold loss of contrast sensitivity than the normal measure of approximately 1%, which causes disabling effects in regular activities [44]. A decline of 2 or more lines in LCVA (recorded at 10% contrast sensitivity) compared to the high-contrast visual acuity is considered a clini cally meaningful difference and can have func tional implications [32]. This is commonly observed in individuals with vision impairment, who are then advised to use appropriate contrast-enhancing measures such as using appropriate illumination and maintaining good target and background contrast in regularly accessed sta tions (such as office desks, kitchen counters, etc.). In ocular conditions, such as albinism, aniridia, and a few retinal dystrophies, filters and tints are recommended to reduce glare and enhance contrast.
First, measuring binocular contrast sensitivity is suggested to quickly understand the patient’s visual concerns in regular clinical practice. Care should be taken to shuffle the optotypes or show different ones to avoid the bias likely to occur due to memorizing them.
Card-based acuity and contrast charts can undergo wear and tear due to extensive usage in the clinics and should be regularly replaced. Using the charts with utmost care is important to avoid incorrect readings. Gloves should be used particularly when handling charts used to assess contrast sensitivity or low-contrast visual acuity, as the discoloration of the charts can make the low-contrast stimuli more challenging to resolve, thereby underestimating the patient’s contrast values.

Fig. 1.10 The LEA numbers near visual acuity chart