1.3.3.1 Low-Contrast Visual Acuity
Similar to high-contrast visual acuity (HCVA), low-contrast visual acuity (LCVA) also tests the resolution of the eye but at contrast levels lower than the HCVA. The HCVA (or simply visual acuity) charts have a contrast level closer to 100%. Contrast levels usually tested for LCVA typically include 10% contrast, as in the Bailey– Lovie low-contrast visual acuity charts. At this level of contrast (i.e., at 10%), the expected reduction in visual acuity is by 2 lines earlier than that in HCVA [32]. The level of visual acuity reduction for different levels of contrast can be understood from the CSF (see Sect. 2.3.2). The factors that affect HCVA also affect LCVA. The blur circles formed due to refractive error impede the low-contrast acuity much more than the high- contrast acuity [33].
1.3.3.2 Contrast Sensitivity Function and Contrast Sensitivity
The CSF measures sensitivity to different con trast levels at different spatial frequencies. It is an inverted U-shaped function. The area under this function is where our visibility for different object sizes and contrasts lies. Every object or contrast outside this curve will be invisible to our eyes. Making those objects visible would require magnification or contrast enhancement, or both.
HCVA is a horizontal measurement in the CSF along the x-axis at 100% contrast value. LCVA is a horizontal measurement in the CSF along the x-axis at a 10% contrast value. The contrast is held constant in both these measures, and the spatial frequency is changed. Contrast sensitivity measure, on the other hand, is a vertical measurement where the spatial frequency (x-axis) is held constant, and only contrast is changed along the y-axis. At the lowest contrast (~1% contrast), the human eye can only see a target size of about 20/200 (or 6/60). This is the peak of the CSF (Fig. 1.7).
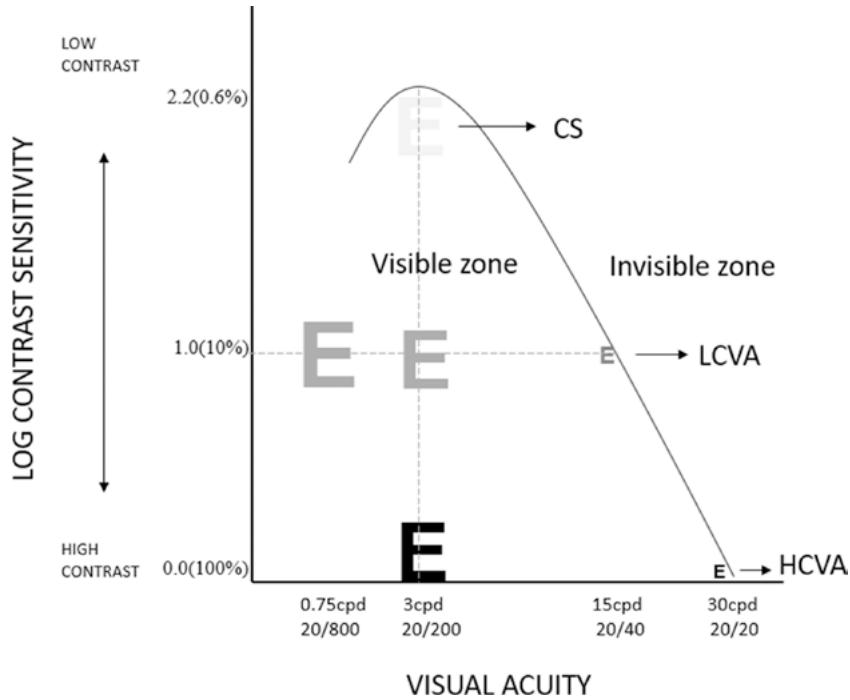
Fig. 1.7 An illustration of the contrast sensitivity function (CSF). On the x-axis are the different spatial frequencies denoted in cpd (cycles per degree) and Snellen fractions. Contrast values vary along the y-axis. CS contrast sensitivity, LCVA low-contrast visual acuity, HCVA high-contrast visual acuity
The high spatial frequency cut-off in CSF is the HCVA or visual acuity limit of the patient. This cut-off is determined by the photoreceptor density that also determines the resolution. The roll-off at the low spatial frequency end of the CSF is due to lateral inhibition of the receptive fields. A receptive field is the extent to which a stimulus can trigger neuronal firing within the neuron. Beyond this, the firing would decrease or cease. The ganglion receptive fields have a center-surround configuration. The center could get stimulated for an ON response, while the peripheral gets stimulated for an OFF response (ON-center, OFF-surround) or vice versa. A tar get big enough to fall within the center would stimulate a receptive field. However, if the target is too big (as in the low spatial frequencies), it falls on both the center and surround, cancelling the stimulation (lateral inhibition). This is why very low-spatial frequencies are also not visible.
Generally, when a reference to “contrast sen sitivity” is made, it refers to the maximum peak in the CSF function. The height of this function is usually between 2 and 4 cpd; this corresponds to an acuity value of 20/200 (6/60) for 3 cpd. This value indicates the lowest contrast that can be detected. The maximum sensitivity (or lowest threshold) of the human eye is about 1% for a target at 20/200 (6/60) size.
1.4 Technique
Visual acuity is the first test most clinicians would do after obtaining a thorough patient his tory. This test should be treated as sacrosanct, and enough time should be given to take a proper measure without rushing and adapting shortcuts (e.g., only showing single letters in an electronic chart). Ideally, thresholding should be done to find the potential visual acuity of a person. There have to be 5 letters shown for each acuity level (i.e., in LogMAR style charts). This would ensure that crowding is uniformly maintained in the dif ferent levels of acuity.
Thresholding means that 50% of the time, the person is right in their response. The conven tional stopping criteria for visual acuity is 3 or more mistakes in a line with 5 letters. Every letter read is valuable information to record, especially in determining improvement with an intervention in randomized clinical trials. It will be important to note such minor details (e.g., 20/20+1 or 20/20-2). Depending on the history, one could decide on which line to start to measure visual acuity. If no complaints are mentioned, one could directly show the 20/32 or 20/25 line and ask the patient to read from there. If difficulty in vision is reported, one could start from 20/200 level and ask the patient to read the first letter. If read cor rectly, the patient can be asked to read only the first letter in each line, essentially going down the chart, till they miss a letter, at which time, the patient should be asked to read the line above fully. This would save time and help reach the visual acuity threshold quickly.
Observe how fast the letters are read; if these are missed systematically on the left/right side, it could indicate a visual field defect. Similarly, peo ple with age-related macular degeneration may have to fixate eccentrically to read. While patients with tunnel vision, like in retinitis pigmentosa or glaucoma, should be oriented to the location of the chart to be able to read and should also be given sufficient time to read. Patients unfamiliar with English letters can be shown alternate opto types such as region-specific optotypes, symbols, pictures, tumbling E, and Landolt C.
1.4.1 Measuring Acuity in Individuals with Vision Impairment
In the case of patients whose visual acuity cannot be recorded at standard testing distances such as 3, 4, and 6 m due to visual impairment, closer testing distances should be considered. Recording acuity by finger counting and hand movement should be avoided as much as possible, as they are not standardized or repeatable measures. When shorter testing distances are used, it is important to perform appropriate conversions (see Box 1.3).
Best corrected distance visual acuity is an important visual function (in addition to the peripheral visual field); it is considered for categorizing vision impairment and providing social
Box 1.3 Examples of Visual Acuity
Conversions for Different Distances in the Metric and Non-metric Systems
Example 1: If a patient reads a 6/60 opto type calibrated for 6 m at a 1-m testing dis tance, then the acuity will be 1/60, equivalent to 6/360 (obtained by multiply ing the numerator and the denominator by 6).
Example 2: If a patient cannot read a 20/796 optotype on a COMPlog system calibrated for 20 feet. The patient can be asked to move closer (to 10 feet); therefore, a 20/796 optotype at 10 feet will be 10/796, equivalent to 20/1592 (obtained by multi plying the numerator and denominator by 2). benefits based on nation-specific acts and regulations. The different categories of vision impairment as per the International Classification of Diseases-11 (ICD-11) [34] are summarized in Table 1.1. There could be a wider variability in the test–retest of visual function parameters in individuals with vision impairment due to factors such as adaptation to illumination levels, disease progression, and psychosocial states. Therefore, the patient should be given adequate time to respond during testing [35].
Charts such as the Berkeley Rudimentary Vision Test (BRVT) (Fig. 1.8) can be used to quantify visual acuity in individuals with severe to profound visual impairment. The acuity range measured using the BRVT is 1.40–2.60 logMAR (i.e., 20/500–20/8000) in a single tumbling E chart. For the grating acuity, the range is 2.30– 2.90 logMAR (i.e., 20/4000–20/16,000), and for the white-field projection (including hemifield and quad-field), the logMin = 3.2 for testing spa tial localization; for a basic visual function test called the black-white discrimination (BWD), the logMin = 3.5 [36]. Note logMin (not log MAR) values given are arbitrary values as per the specifications of the test card. If the patient’s visual acuity is unrecordable with any of the measures discussed above, projection of rays (in all 4 quadrants) and perception of light should be documented.
Table 1.1 Categories of vision impairment as per the International Classification of Diseases-11 (ICD-11) [34]