Visual Acuity: High Contrast and Low Contrast
Rebecca Sumalini and PremNandhini Satgunam
1.1 Introduction
There are many components of vision. These include visual acuity, contrast sensitivity, visual fields, 3D vision, motion perception, etc. Of all these components, the most important compo nent is visual acuity, the ability of the eye to resolve and perceive small targets. There are vari ous methods and ways to measure this resolution capacity of the eye. All these methods use black letters on a white background. Ironically, none of the real-world scenes and scenarios appear in black and white. The visual function that is more relevant to the real-world scenario is contrast sen sitivity. Contrast sensitivity is the ability of the eye to detect the dimmest target and largely depends on the background (for example, a white bead placed on a white tabletop has poorer con trast than a gray bead on a white tabletop). This ability of the eye to distinguish the contrast of the target against the background is also related to the size of the object. If this ability is mapped for different target sizes, we arrive at the contrast sensitivity function (CSF). Interestingly, high- contrast visual acuity (or visual acuity) is only a single-point measurement within the CSF (see Sect. 2.3.2). Yet, we mostly draw conclusions and correlate patients’ complaints and functional vision difficulties (e.g., identifying faces, pouring water into a cup) with the visual acuity value. Unfortunately, measures of contrast sensitivity have been mainly restricted to low-vision prac tice or research. However, for those patients whose symptoms are not explained through the “regular” visual acuity, measuring contrast sensi tivity or low-contrast visual acuity may be insightful.
This chapter gives an equal importance to visual acuity, contrast sensitivity, and low- contrast visual acuity. The importance of these measurements, with commonly used and com mercially available tests, is discussed. Some spe cial scenarios in which the conventional measurements are difficult are also discussed, with available alternate options.
R. Sumalini Institute of Vision Rehabilitation, Kallam Amji Reddy Campus, L V Prasad Eye Institute, Hyderabad, India e-mail: rebecca@lvpei.org
P. Satgunam (☒) Brien Holden Institute of Optometry and Vision Sciences, Prof. Brien Holden Eye Research Centre, L V Prasad Eye Institute, Hyderabad, Telangana, India e-mail: premnandhini@lvpei.org
1.2 History
1.2.1 Visual Acuity Tools
The origin of standardized visual acuity testing dates back to 1862 by the Dutch ophthalmolo gist Hermann Snellen; this test is widely known as the Snellen chart [1]. The most commonly used notation for visual acuity is the Snellen fraction (e.g., 20/20 or 6/6), a format easily understood by all clinicians and researchers. The numerator is the test distance, and the denominator is the distance from which the let ter should be visible. Therefore, visual acuity of 20/200 indicates what is visible from 200 feet to a normally sighted individual, is only visible from a closer distance of 20 feet to someone with visual impairment. The Snellen acuity chart, despite its wide use, has several limita tions. These include an unequal number of let ters in each acuity line, unequal size progression of optotypes between acuity lines, unequal spacing between the letters, and reliability con cerns. To address these shortcomings, the log MAR chart was developed in 1976 by Ian Bailey and Jan Lovie-Kitchin [2]. The chart had a uni form number of letters, uniformly spaced pro gression, and proportionate spacing between the letters.
In 1982, the National Eye Institute used the Sloan letter set (i.e., non-serif letters) and logMAR principles as described by Bailey and Lovie [2] and produced the current “gold-standard” ETDRS chart (Early Treatment of Diabetic Retinopathy Study) (Fig. 1.1, left) [3]. In addition to English letters, several other optotypes have been developed for individuals unfamiliar with English optotypes, such as letters of different languages (e.g., Chinese [4], Arabic [5], Hindi [6]), LEA symbols ((named after the inventor Lea Hyvarinen) [7]) (Fig. 1.1, middle), tumbling E [8], and Landolt C charts [9]. The recent computer-based visual acuity measurement tool, COMPlog (Fig. 1.1, right) [10] has several advantages such as ease of use, easy maintenance, and the ability to shuffle between and within optotypes whenever required.
Based on the preferential-looking principle, grating acuity tests are the tests of choice for preverbal/non-verbal individuals. Robert Fantz first described the principle in 1965 [11]. The currently used Teller acuity cards-II (Fig. 1.2, left) is a modified prototype of the same after several iterations. A handful of grating acuity tests are available (such as Keeler acuity cards and LEA gratings paddle), including the app-based grating acuity test, such as the Peekaboo Vision application (Fig. 1.2, right) [12].
Near visual acuity is a valuable measurement given that most of our day-to-day activities involve several near tasks such as reading, writing, and household chores (including cooking), to name a few. Jaeger cards were first developed by the Austrian ophthalmologist Eduard Jaeger in 1854 for checking near visual acuity [13] . The text size of the reading text progresses from 0.37 to 2.5 mm [14] . These cards have been discontinued because of a lack of standardization [15] . In 1980, Ian Bailey and Jan Lovie-Kitchin developed the Bailey–Lovie word reading charts (Fig. 1.3); these consisted of random words with a logarithmic progression of lines.
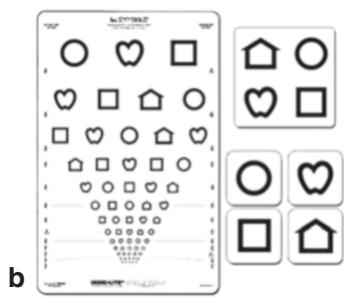

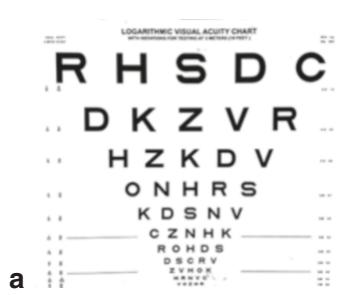
Fig. 1.1 Recognition acuity tests: (left) ETDRS chart, (middle) LEA symbols, and (right) COMPlog electronic chart. ETDRS early treatment of diabetic retinopathy study, COMPlog computerized logarithmic test

Fig. 1.2 (left) Grating acuity assessment using teller acuity cards-II (without testing stage) and (right) the Peekaboo Vision application