Other higher-order aberrations
Although there are numerous other higher-order aberrations, only a few are of clinical in terest. As knowledge of surgically induced aberration increases, more types of aberrations may become clinically relevant.
Effect of excimer laser ablation on higher-order aberrations
The use of conventional excimer laser ablation typically increases higher-order aberra tions, and the effect is correlated with the degree of preoperative refractive error. After standard myopic laser vision correction, the cornea assumes an oblate shape, inducing positive spherical aberration. In hyperopic ablation, treatment is applied to the midperiph eral cornea relative to the central cornea, increasing the central curvature of the cornea, resulting in a hyperprolate cornea that generates greater amounts of negative spherical aberration (see the section Corneal Imaging for Keratorefractive Surgery and Figure 1-1).
However, compared with conventional laser treatment, wavefront-optimized, wavefront- guided, and topography-guided ablations may decrease the number of induced higher-order aberrations and, in principle, may be able to reduce preexisting higher-order aberrations and provide better-quality vision, particularly in mesopic conditions.
Holland S, Lin DT, Tan JC. Topography-guided laser refractive surgery. Curr Opin Ophthalmol. 2013;24(4):302–309.
Corneal Imaging for Keratorefractive Surgery
Corneal shape, curvature, and thickness profiles can be generated from a variety of tech nologies such as Placido disk–based systems and elevation-based systems (including scanning-slit systems and Scheimpflug imaging). Each technology conveys different in formation about corneal curvature, anatomy, and biomechanical function. Computerized topographic and tomographic systems may also display other data, including pupil size and location, indices for estimating regular and irregular astigmatism, estimates of the probability of keratoconus, simulated keratometry, and corneal asphericity. Other topo graphic systems may integrate wavefront aberrometry data with topographic data. Al though such additional information can be useful in preoperative surgical evaluations, no automated screening system can supplant clinical experience in evaluating corneal imaging.
The degree of asphericity of the cornea can be quantified by determining the Q value, with Q= 0 for spherical corneas, Q< 0 for prolate corneas (relatively flatter periphery), and Q> 0 for oblate corneas (relatively steeper periphery). A normal cornea is prolate, with an asphericity Q value of –0.26. Prolate corneas minimize spherical aberrations by virtue of their relatively flat peripheral curve. Conversely, oblate corneal contours, in which the peripheral cornea is steeper than the center, increase the probability of induced positive spherical aberrations (see Figure 1-1).
Corneal Topography
Corneal topography provides highly detailed information about corneal curvature. To pography is evaluated using keratoscopic images, which are captured from Placido disk patterns (mires) that are reflected from the tear film overlying the corneal surface and then converted to computerized color scales (Fig 1-9). Because the image is generated from the anterior surface of the tear film, irregularities in tear composition or volume can have a major impact on the quality and results of a Placido disk–based system. Given this effect, it is extremely important to review the Placido image (image of the mires) before inter preting the maps and subsequent numerical data. In addition, Placido disk–based systems are referenced from the line that the instrument makes to the corneal surface (called the vertex normal). This line is not necessarily the patient’s line of sight or the visual axis, which may lead to confusion in interpreting topographic maps. For a more extensive dis cussion of computerized corneal topography, refer to BCSC Section 3, Clinical Optics.
Corneal topography maps provide color scales to represent curvature data. Two types of scales are commonly used: absolute (or standard) scale and normalized (or relative) scale. These color scales appear on the left margin of the map; the top of the scale represents the steepest curvature, and the bottom of the scale represents the flattest curvature. Areas of steeper curvature are represented by warmer colors, such as red and orange, and areas of flatter curvature by cooler colors, such as green and blue. The absolute scale displays a fixed color-coding map, with each color representing a 1.5-D interval between 35 and 50 D. The same color always represents the same power, allowing easy comparisons between different maps. In contrast, the normalized scale spans the eye’s total dioptric power, thus providing more detailed topographic information. It is important to note the diopter change between colors when using the normalized scale. Too large a difference between colors can mask sig nificant abnormalities, while too little difference can “smooth” over significant abnormalities.
Axial power and curvature
Axial power representation derives from the assumption that the cornea is a sphere and that the angle of incidence of the instrument is normal to the cornea. Axial power is based on the concept of “axial distance” (Fig 1-10). As shown in the illustration, axial power underestimates steeper curvatures and overestimates flatter curvatures. This representa tion is also extremely dependent on the reference axis employed: optical or visual. Maps of the same cornea generated by these 2 reference axes will look very different from each another. Axial power representations actually average the corneal powers and thereby provide a “smoother” depiction of corneal curvature than does the tangential, or instan taneous, method. Although the curvature and power of the central 1–2 mm of the cornea are generally not well imaged by Placido disk techniques, they can be closely approximated by the axial power and curvature indices (formerly called sagittal curvature); however, the central measurements are extrapolated and, thus, potentially inaccurate. These indices also fail to describe the true shape and power of the peripheral cornea. Topographic maps displaying axial power and curvature provide an intuitive sense of the physiologic flatten ing of the cornea but do not represent the true refractive power or the true curvature of peripheral regions of the cornea (Figs 1-11A, 1-12).
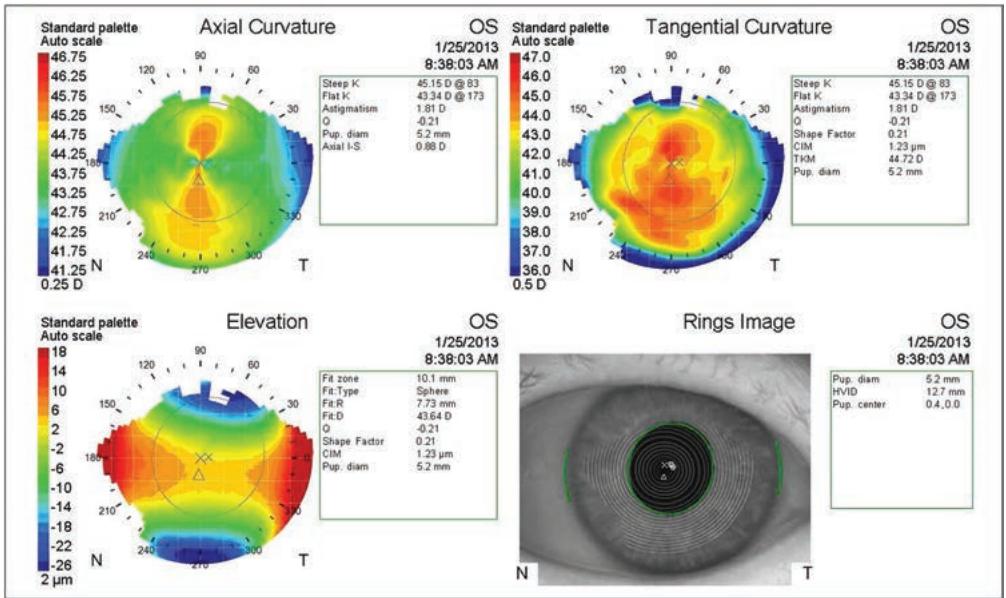
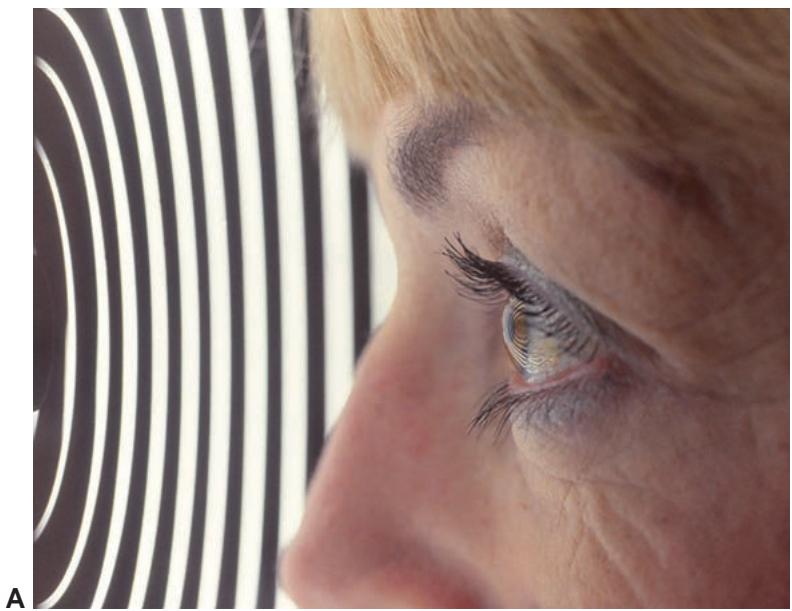
Figure 1-9 Placido imaging of the cornea. A, The reflected mires from the Placido device can be seen on this patient’s cornea. This image is then captured and analyzed. B, The captured Placido image is seen in the lower right-hand corner, and the different types of color maps derived from it appear in the other corners. (Courtesy of M. Bowes Hamill, MD.)