
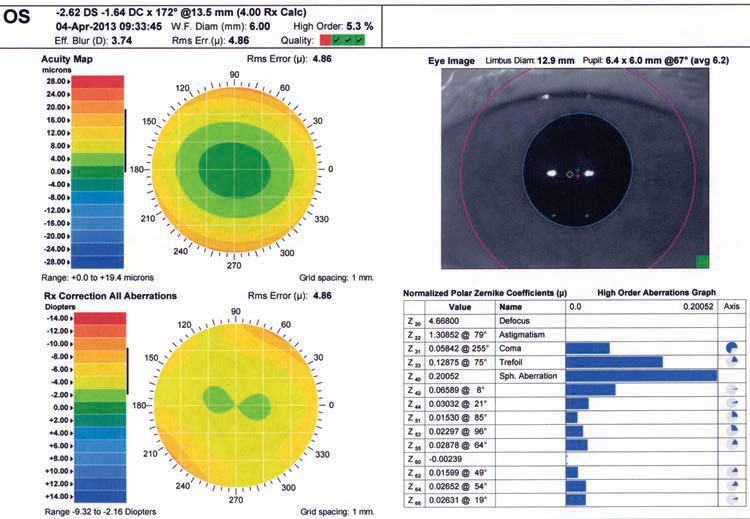
Figure 1-15 (continued) C, Corneal tomography image using dual Scheimpflug/Placido–based technology. The surface curvature, pachymetry, and anterior and posterior elevation mappings are shown. Numerical values appear along the right side. D, Wavescan image from a device like that illustrated in Fig 1-2A, taken of the fellow eye of the one seen in parts A, B, and C. Note that this map does not show corneal surface contours or features but rather provides information about the optics of the entire ocular system. As such, it can provide information on the refractive error and aberrations of the entire eye. (Courtesy of M. Bowes Hamill, MD.)
OS
-2.62 DS -1.64 DC x 172° @13.5 mm (4.00 Rx Calc) 04-Apr-2013 09:33:45 W.F. Diam (mm): 6.00 High Order: 5.3% Eff. Blur (D): 3.74 Rms Err.(μ): 4.86 Quality:
D
B

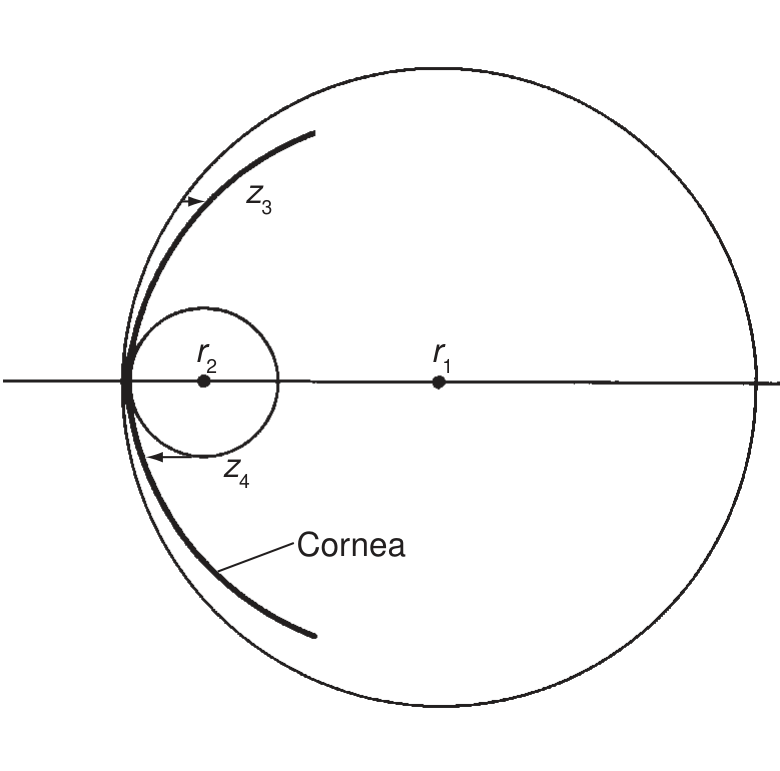
Figure 1-16 Height maps (typically in $ \mu\mathrm{m} $). A, Height relative to plane surface; $ z_{1} $ is below the surface parallel to the corneal apex, and $ z_{2} $ is above the surface parallel to the corneal limbus. B, Height relative to reference sphere; $ z_{3} $ is below a flat sphere of radius $ r_{1} $, and $ z_{4} $ is above a steep sphere of radius $ r_{2} $. (Illustration by Christine Gralapp.)

Figure 1-17 Scheimpflug tomography difference maps demonstrating corneal power change before and after myopic LASIK. (Courtesy of Karolinne Maia Rocha, MD, PhD.)

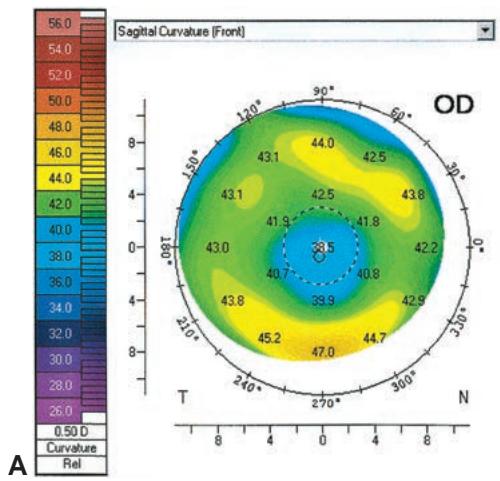
Figure 1-18 Postablation topographic maps. A, Small optical zone after excimer laser ablation; B, decentered ablation. (Courtesy of J. Bradley Randleman, MD.)
the stroma’s swelling and load-bearing properties. When the cornea is in a normally hy drated state, stress is distributed relatively evenly across the corneal depth. In the pres ence of corneal edema, the anterior lamellae take up most of the stress and the posterior fibers become lax, which can be visualized as stromal folds that propagate to the Descemet membrane.