Refractive Error: Optical Principles and Wavefront Analysis
One of the major applications of the wave theory of light is in wavefront analysis (see also BCSC Section 3, Clinical Optics). Currently, wavefront analysis can be performed clinically by 4 methods: Hartmann-Shack, Tscherning, thin-beam single-ray tracing, and optical path difference. Each method generates a detailed report of lower-order aberrations (eg, sphere and cylinder) and higher-order aberrations (eg, spherical aberration, coma, and trefoil). This information is useful both in calculating custom ablations to enhance vision or to correct optical problems and in explaining patients’ visual symptoms.
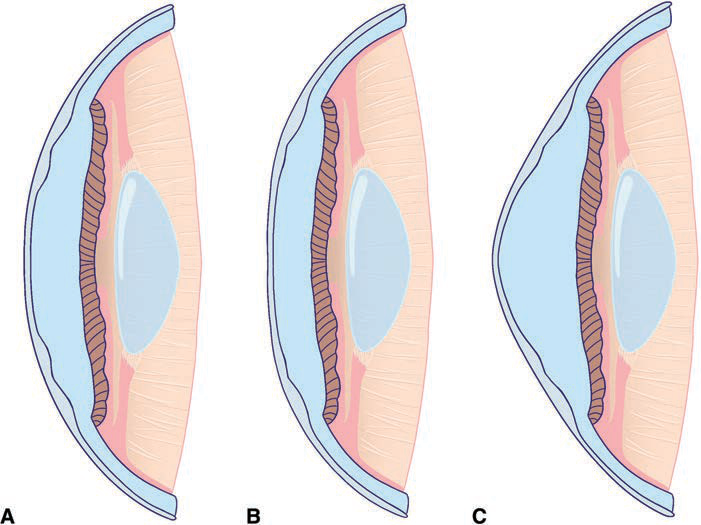
Figure 1-1 Examples of corneal profiles. A, Prolate cornea (the normal corneal shape), steeper centrally and flatter in the periphery. B, Oblate cornea (eg, after myopic ablation), flatter centrally and steeper in the periphery. C, Hyperprolate cornea (eg, after hyperopic ablation). (Courtesy of Raquel Gouvea and Larissa Gouvea, MD.)
Measurement of Wavefront Aberrations and Graphical Representations
Of the several techniques for measuring wavefront aberrations, the most popular in clinical practice is based on the Hartmann-Shack wavefront sensor. With this device, a low-power laser beam is focused on the retina. A point on the retina acts as a point source, and the reflected light is then propagated back (anteriorly) through the optical elements of the eye to a detector. In an aberration-free eye, all the rays would emerge in parallel, and the reflected wavefront would be a flat plane. In reality, the reflected wavefront is not flat. To determine its shape, an array of lenses samples parts of the wavefront and focuses light on a detector (Fig 1-2; see also BCSC Section 3, Clinical Optics). The extent of the divergence of the lenslet images from their expected focal points determines the wavefront error (see Figure 1-2B). Optical aberrations measured by the aberrometer can be resolved into a variety of basic shapes, the combination of which represents the total aberration of the patient’s ocular sys tem, just as conventional refractive error is a combination of sphere and cylinder (Fig 1-3).
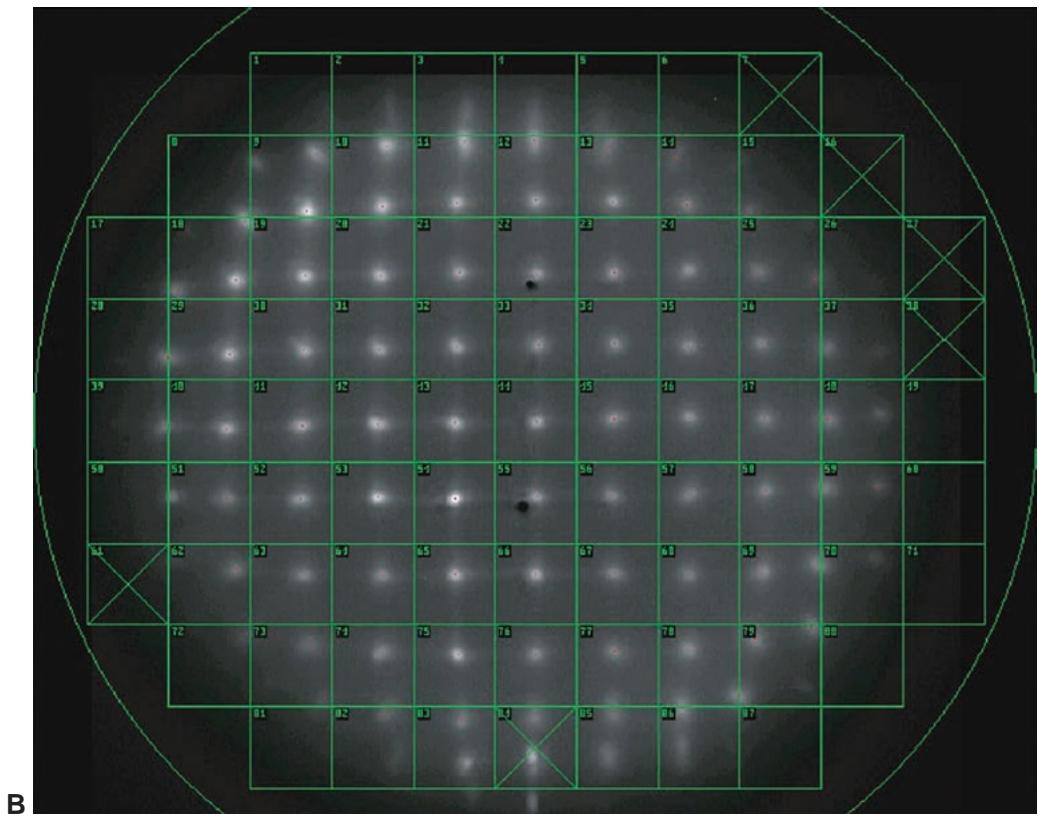
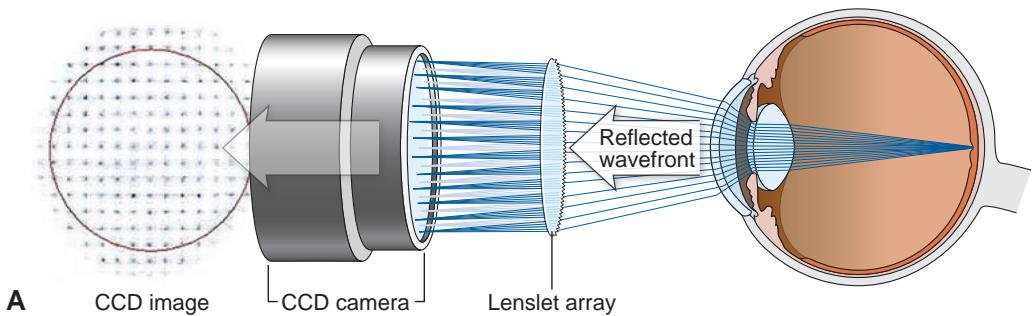
Figure 1-2 Schematic of a Hartmann-Shack wavefront sensor. A, The reflected wavefront passes through a grid of small lenses (the lenslet array), and the images formed are focused onto a charge-coupled device (CCD) chip. The degree of deviation of the focused images from the expected focal points determines the aberration and thus the wavefront error. B, Example of the images formed after the wavefront passes through the lenslet array. The green overlay lattice is registered to correspond to each lenslet in the array. (Part A redrawn by Mark Miller from a schematic image courtesy of Johnson & Johnson.)
Currently, wavefront aberrations are most commonly specified by Zernike poly nomials, which are the mathematical formulas used to describe the surfaces shown in Figures 1-4 through 1-8. Each aberration may be positive or negative in value and in duces predictable alterations in the image quality. The magnitude of these aberrations is expressed as a root mean square (RMS) error, which is the deviation of the wavefront averaged over the entire wavefront. The higher the RMS value, the greater is the overall aberration of a given eye. The majority of patients have total RMS values less than 0.3 μ m for a 6-mm pupil. Most higher-order Zernike coefficients have mean values close to 0. The most important Zernike coefficients affecting visual quality are defocus, spherical aberration, coma, and secondary astigmatism.
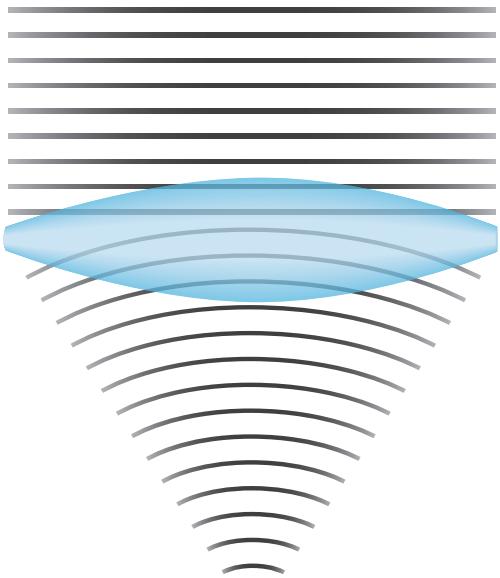
Figure 1-3 Wavefronts change shape after going through a lens. (Redrawn by Cyndie C. H. Wooley from a schematic image from https://en.wikipedia.org/wiki/Wavefront.)
Fourier analysis is an alternative method for evaluating the output from an aberrom eter. This method involves a sine wave–derived transformation of a complex shape. Com pared with shapes derived from Zernike polynomial analysis, those derived from Fourier analysis are more detailed, theoretically allowing for the measurement and treatment of more highly aberrated corneas.
Klyce SD, Karon MD, Smolek MK. Advantages and disadvantages of the Zernike expansion for representing wave aberration of the normal and aberrated eye. J Refract Surg. 2004;20(5):S537–S541.
Salmon TO, van de Pol C. Normal-eye Zernike coefficients and root-mean-square wavefront errors. J Cataract Refract Surg. 2006;32(12):2064–2074.